Ruby on RailsのN+1 partial renderingのパフォーマンス悪化を測定してみました。
環境
| Ruby | 2.4.1 |
| Rails | 5.1.1 |
| DB | MySQL |
| OS | macOS Sierra |
計測用のコード
コントローラclass PartialRenderController < ApplicationController
def index
@contents = Content.limit(1000)
case params[:type]
when 'single'
render :single and return
when 'collection'
render :collection and return
end
end
end
N+1パーシャルレンダリングのビューファイル
<% @contents.each do |content| %>
  <%= render 'record', content: content %>
<% end %>
コレクションを使ったレンダリングのビューファイル
<%= render 'records', contents: @contents %>
計測方法
peek-rblineprofで行レベルで計測しつつ、stackprofでメソッドごとの負荷を確認。また、Railsの環境はdevelopmentで動かしています。production環境だと今回の計測結果よりかなり早くなるようです。結果
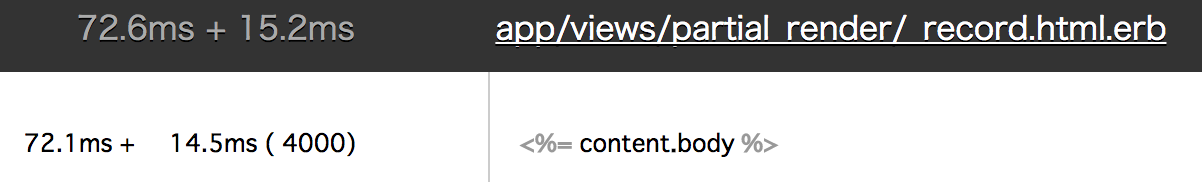
1000回のパーシャルレンダリングのラインプロファイルの結果は以下になります。renderの部分がボトルネックになっています。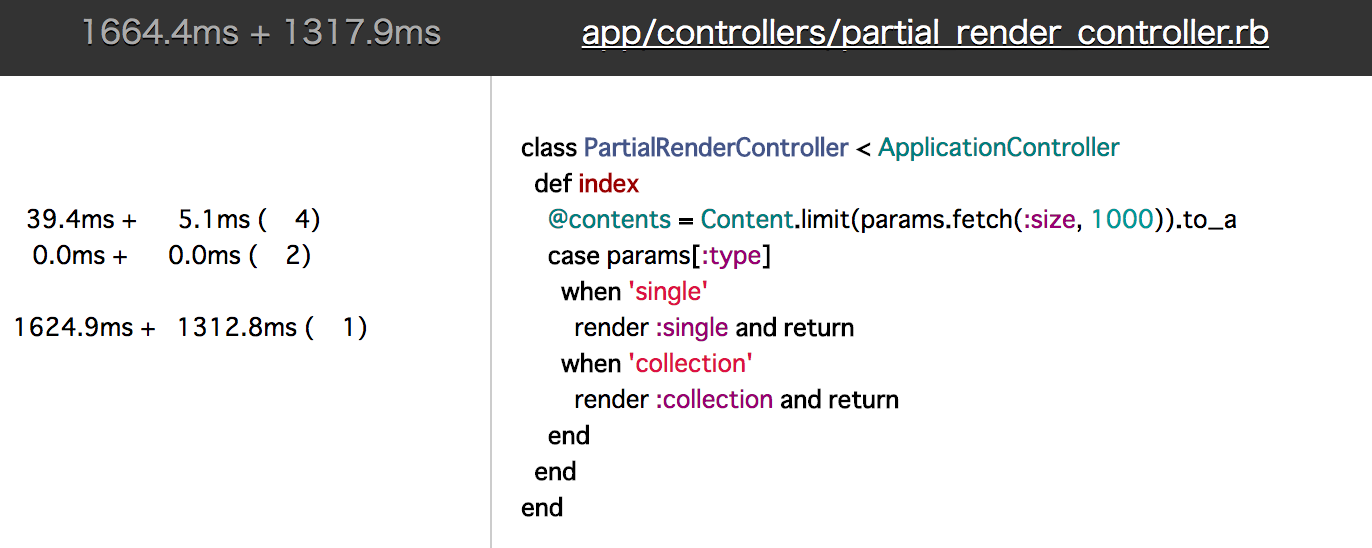
viewファイルを見るとパーシャルレンダリングで時間がかかっています
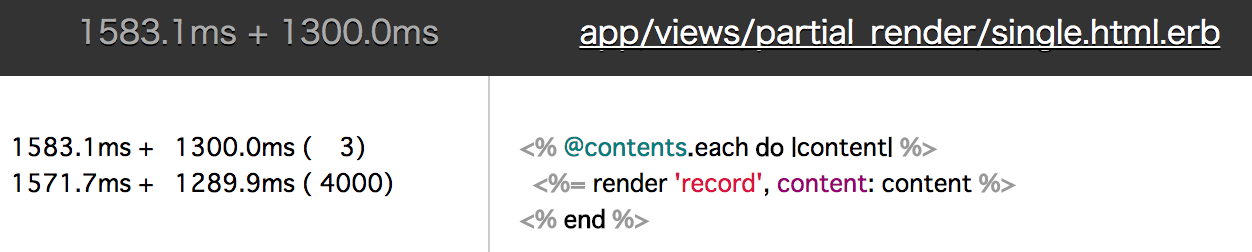
ブロックの処理自体にはそこまで時間がかかっていません
実際どの程度パフォーマンスを悪化させるのかを見るためにパーシャルレンダリングの回数とパフォーマンスについて調査しました。
| 回数 | CPU time + (wall time - CPU time) |
| 10 | 15.6ms + 9.8ms |
| 100 | 177.1ms + 166.6ms |
| 1,000 | 1622.2ms + 1473.2ms |
| 10,000 | 13625.4ms + 13337.2ms |
| 10,000 (コレクション) | 172.3ms + 61.8ms |
1000回のパーシャルレンダリング時のstackprofの結果は以下のとおり
$ stackprof stackprof-cpu-75585-1500279146.dump
==================================
  Mode: cpu(1000)
  Samples: 1719 (23.09% miss rate)
  GC: 8 (0.47%)
==================================
     TOTAL    (pct)     SAMPLES    (pct)     FRAME
      2066 (120.2%)        1035  (60.2%)     ActionView::PathResolver#find_template_paths
       584  (34.0%)         290  (16.9%)     Logger::LogDevice#write
      1407  (81.8%)         154   (9.0%)     ActionView::PathResolver#query
        41   (2.4%)          21   (1.2%)     Rack::MiniProfiler::FileStore::FileCache#[]=
        18   (1.0%)          18   (1.0%)     ActionView::PathResolver#mtime
        13   (0.8%)          10   (0.6%)     ActionView::LogSubscriber#from_rails_root
        10   (0.6%)          10   (0.6%)     ActiveSupport::NumericWithFormat#to_s
         8   (0.5%)           8   (0.5%)     Mysql2::Result#each
         7   (0.4%)           7   (0.4%)     Concurrent::Collection::NonConcurrentMapBackend#[]
        19   (1.1%)           7   (0.4%)     ActionView::OptimizedFileSystemResolver#build_query
       332  (19.3%)           7   (0.4%)     ActiveSupport::Logger#add
         6   (0.3%)           6   (0.3%)     Sprockets::PathUtils#entries
         5   (0.3%)           5   (0.3%)     ActiveRecord::Attribute#initialize
         5   (0.3%)           5   (0.3%)     ActiveSupport::SafeBuffer#initialize
ActionView::PathResolver#find_template_pathsやActionView::PathResolver#queryでかなり時間を使っていることがわかります。